
Getting started with TrainingPeaks

Knowing exactly what to measure and how to do it most efficiently can be overwhelming—but only at first. There are a wide range of available devices in which to record everything from distance and duration to heart rate, power, cadence, and more. If you are an athlete just starting out and not quite ready to make the investment in a GPS device, there are several smartphone apps that can record your workouts. Once you have decided on how you are going to record your workouts, the next step is uploading them to your TrainingPeaks account.
Once your workout is in your account you can click on the completed workout, which will open a quick view summary of information, including how long the workout was and how far you ran or rode. You may also notice some three-letter acronyms listed as well, such as TSS and IF—but what the heck do they mean, and how can you use them? These abbreviations represent some of the metrics that you will find in TrainingPeaks, and they are the key to measuring improvement and reaching your potential!
Functional Threshold (FTP)
Most of the metrics in TrainingPeaks are based on a Functional Threshold (Power, Pace, or Heart Rate), so it is important that you have this right before jumping ahead to some of the other metrics. Functional Threshold represents the maximal effort you can maintain for around an hour without fatiguing. For some athletes this will be less than an hour and for others it might be slightly longer, but the important thing is that it provides a useful benchmark by which to measure your training.
To get the most accurate number you will need to perform an hour-long test and then use the average power, pace, or heart rate from that test as your threshold. However, going all out for an hour is HARD and requires a lot of focus and motivation—not to mention it could be very disruptive to your other training. So instead of performing an hour-long test, consider using one of these other methods, which are shorter but still provide a good estimate of your Functional Threshold.
You can learn more about getting started training with power here.
Normalized Power (NP) or Normalized Graded Pace (NGP)
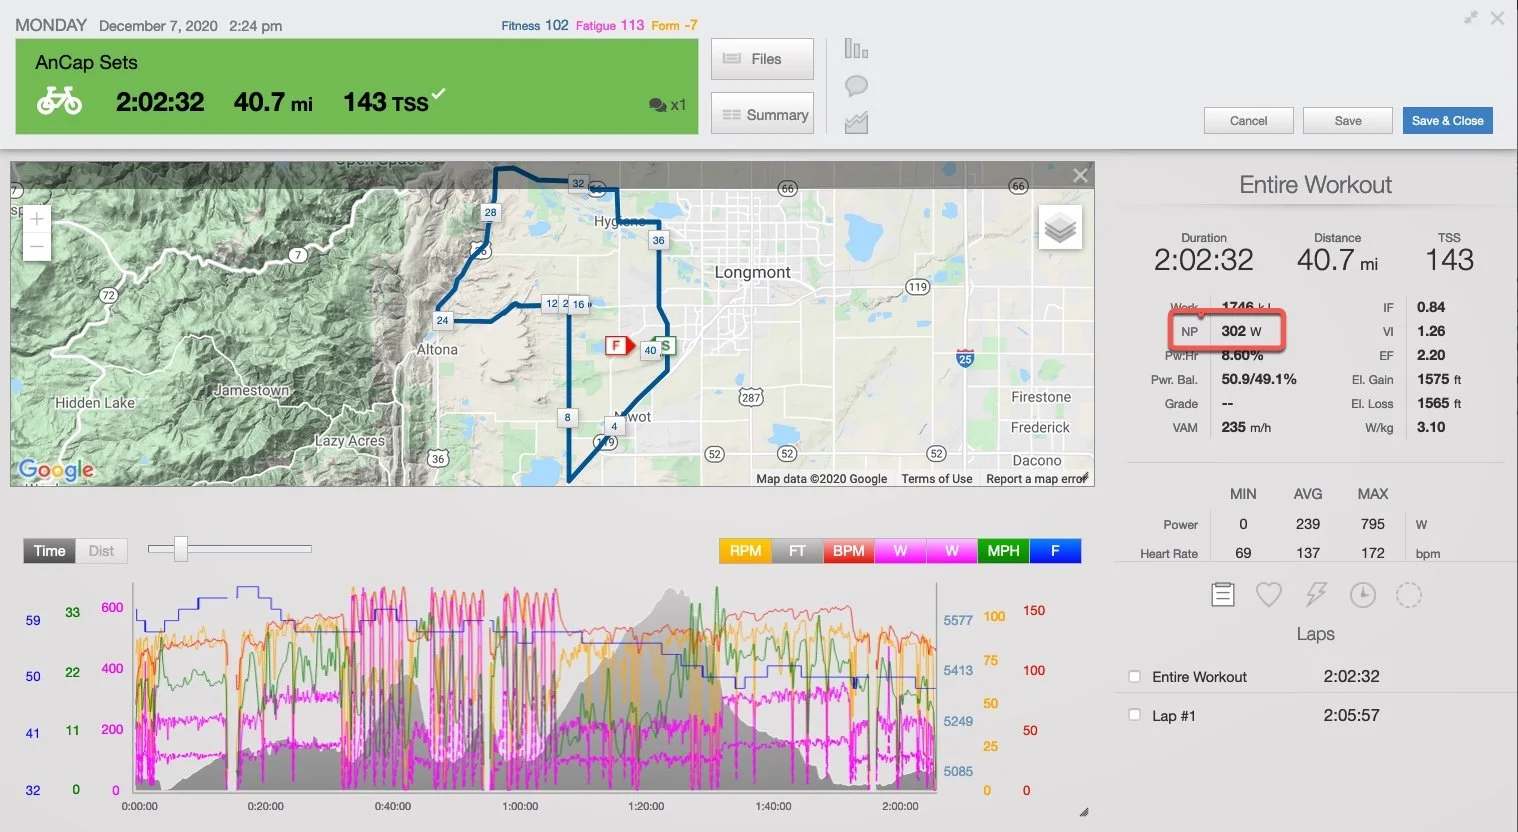
In cycling, NP provides an estimate of the metabolic cost if the ride would have been paced steadily and places an emphasis on the surges during the ride.
Think of riding your bike like driving a car. You are going to use less gas while driving on the highway at a steady speed than you would driving in the city and constantly having to come to a stop and hit the gas again to get back up to speed. NP provides a picture of how hard a ride felt, so while the Average Power may be relatively low, the Normalized Power could be high due to surges in speed throughout the ride duration.
In running, NGP takes the hills into account and estimates what your pace would have been if you were running on a flat course.
Intensity Factor (IF)
Now that we know how hard we can go for around an hour (FTP) and we have a way to estimate how metabolically taxing a workout was (NP/NGP), we can now measure how intense that workout was relative to our threshold through the Intensity Factor (IF).
IF is simply how intense a workout was relative to your threshold and can be read as sort of a percentage of 1, with 1.0 being your threshold. If the IF for your workout was 0.80, we could say that you performed that workout at 80% of your threshold.
General endurance work falls in the 60-70% range, while a harder tempo workout would be closer to 80-90%. Additionally, depending on the duration of your race, you may see an IF of up to 105%, or 1.05. IF is calculated by dividing your NP or NGP by your functional threshold. So, if your FTP is 250 watts and you did a workout with an NP of 200 watts, then you would end up with an IF of 0.8, or 80% of your threshold.
In addition to providing information on the relative intensity of your workout, you can also use this number to get an idea of the relative intensity of different race durations.
Training Stress Score (TSS)
Finally, we have Training Stress Score®, which is a score given to a workout to tell you how hard it was. Whereas IF told you the intensity of a workout relative to your threshold, it is only one side of the equation. If you did a workout at 90% of your threshold for two hours, it would surely be much more stressful than doing 90% of your threshold for 45 minutes.
TSS takes both intensity and duration into account and provides you with a more complete view of how stressful that workout was in the overall picture of your training. To take this idea a step further, TrainingPeaks uses this daily TSS to model your Fitness, Form, and Fatigue by using a weighted average of a set number of days and modeling them in the Performance Management Chart. All of this provides you with an invaluable way to visualize your training load and plan the perfect peak for your next event.
What is the Performance Management Chart?
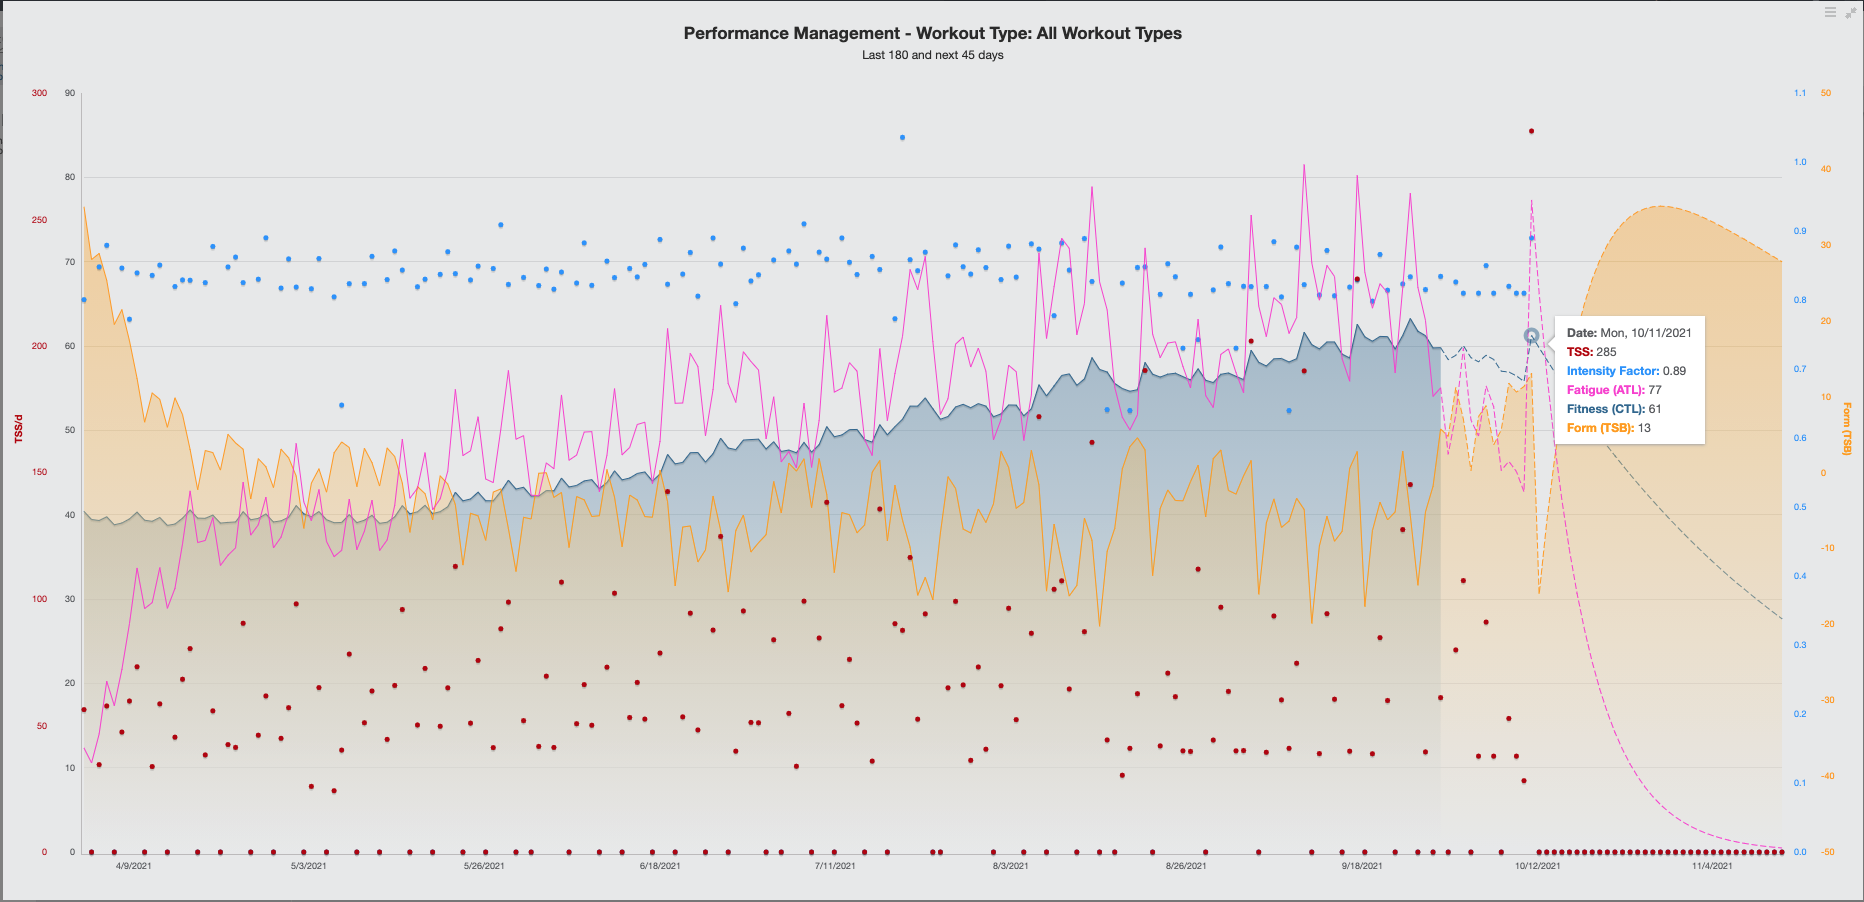
The Performance management chart helps you plan and measure your training as your season progresses. It works by charting your daily Training Stress Score (TSS), which is based on the duration and intensity of each workout.
Your daily TSS can give you valuable insights into your cumulative training, including your fatigue (7 day average), your fitness (42 day average) and your form (yesterday’s fatigue subtracted from yesterday’s fitness).
The PMC maps these metrics concurrently so you can see how your daily training affects your fitness goals.
CTL – Chronic Training Load | Fitness
Think of Chronic Training Load as a measure of your true fitness. It’s an ongoing average of your daily training (TSS load) specifically looking at the last six weeks or 42 days of data points. This ultimately shows your long-term training load and gives a trend line of where the athlete is going. A positive (upward) trending line shows an increasing training load and decreasing (downward line) shows a decreasing level of incurred training load.
Steady progression is key to preventing injuries. Large spikes in CTL correlate with a large amount of incurred training stress. Very fit athletes can increase their CTL up to five-to-seven points a week. As coaches, we should ensure that a large amount of training load pairs with a substantial recovery to avoid injury.
CTL and TSS are related and you can use the scale below to determine the intensity of a workout with respect to your current fitness. In this example, we’ll assume the athlete has a CTL of 50.
ATL – Acute Training Load | Fatigue
Acute Training Load looks at how your most recent training impacts your body. Acute Training Load calculates a rolling average of your workout TSS over the last seven days. There is a correlation between fatigue and fitness scores—when your fatigue score is less than your current fitness score, you will normally see a positive TSB value. However, if you are deep into training you will see a fatigue score that is greater than your CTL score.
Carefully monitor an athlete’s ramp for every value as heavy fatigue loads can be deceiving and require a longer recovery time. Steep inclines indicate large loads and will result in a significant and resultant inverse TSB. If you’re doing lots of high TSS workouts, you can expect high ATL scores. You can bring down high ATL scores by doing recovery (low TSS) workouts in addition to rest days.
TSB – Training Stress Balance
Training Stress Balance is the “ready to race” metric where the more negative the number, the deeper in “the hole” an athlete is and the more positive the number the more recovered and ready perform the athlete is. Just like ATL, this is a near-term metric that measures your form and gives insight into the athlete’s race readiness. This metric has a couple of rough rules that can help guide athletes and coaches. Athletes should rely on their past experiences and recent performances to determine how recovered they need to be to perform well.